
Exploring Graphs of the Exponents
By
Cassian Mosha
Graph the following exponential expression

What do you expect of the
graphs of
OR

The first thing I will do is
to graph the first function and see what kind of graph do I get. Then I will
graph the second expression also and see what kind of graph I am also getting.
Then I will draw all graphs of the even factors and then the odd factors and
see how all behaves.
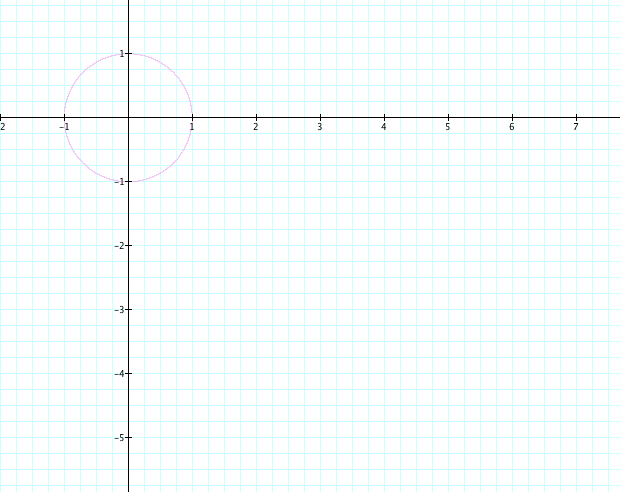
Gaph #1
Equation for the above
graph. ![]()
The expression gave a graph
of a circle with a radius of one unit with x-intercepts at (1, 0) and (-1, 0).
The y-intercepts are (0, 1) and (0, -1). The graph is centered at (0, 0).
Now let’s draw the graph for
the next equation i.e 
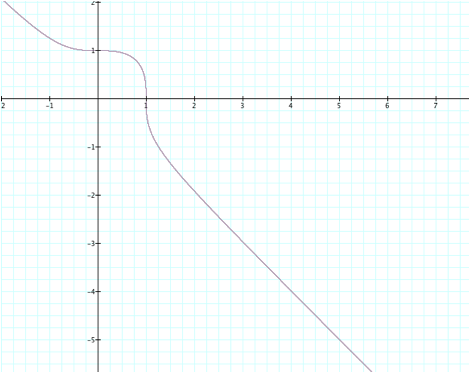
Graph #2
The above graph of the third
power exponent looks like a bump and it intersects y-axis at (0,1), and x-axis
at (1, 0).
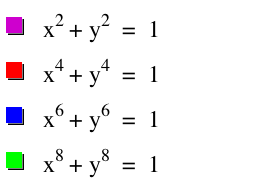
Now I will graph all the expressions
with even exponents and see what happens.
Graph #4
We can see that as the power
of the exponent expands, the edges of the square becomes more smooth and
the square looked more perfect than when it was of a smaller even power. We can
then generalize that as the power grows bigger and bigger, the graph
changes from the circle of radius one unit to a square of two units width. Now let us examine the expressions with
the exponent values of 22, 24, 26 and 28.

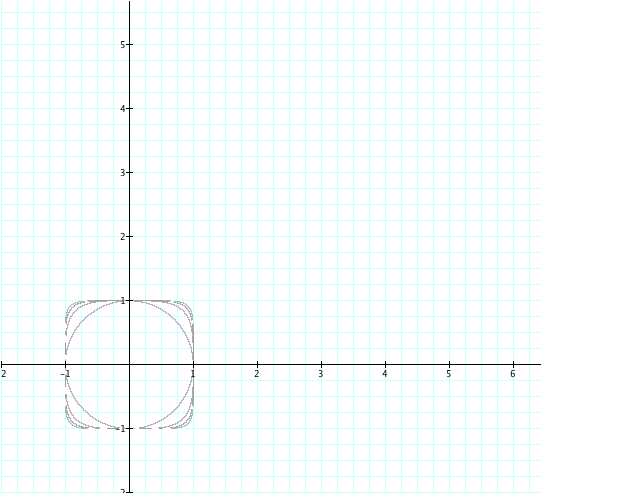
Graph #5
Now we can see how the graph
changed. For exponent power 22 and above the graph does not change, and it
is a perfect square although its edges are a little bit curved, but it is a single figure as seen on the graph above. We can conclude that as the power of
the exponent expands, the graph of the given function remains the same, and it is a square.
Now we will examine the odd
powers and see what happens.
Graph #6
Here we see the same graphs
and the bump is shrinking in width, but peaking high as the powers grows
bigger. The intercepts are the same and both ends grow to infinity. Now we need
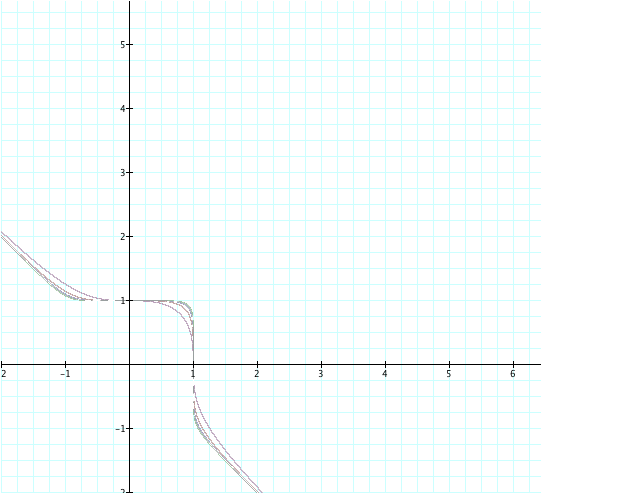
to see what will happen if the powers of the exponent are as high as 23, 25, 27
and 29.
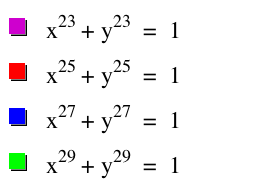

Graph #7
As we can see from the graph that
as we reach the higher exponent powers of the expression the bump reached a
maximum and straighten up to be straight lines passing through points (1,0) and (0,1) forming a right angle
mimicking the square we just concluded above. Now I need to make one more
exploration and that is what will happen if I change the center of the circle,
that is what will happen if I make
the expression equals to some different number, say 2.
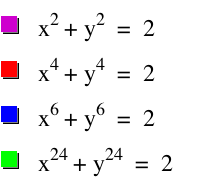
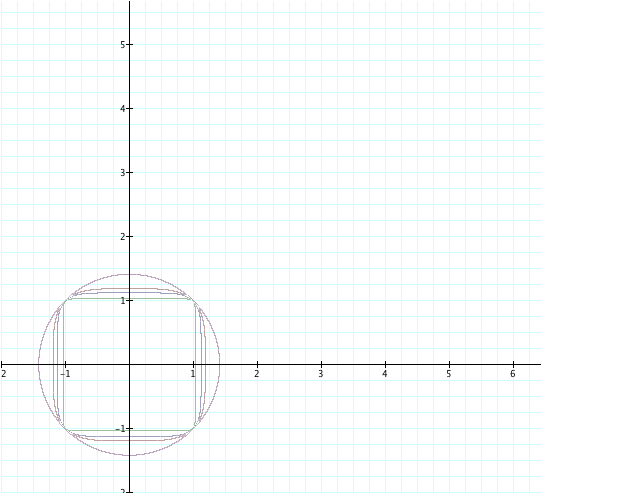
Graph #8
As we can see in the graph above the picture did change. What changed was the center of the circle and the intercepts, also the squares now are inside the circle as opposed to figure 4 above. This shows a clear distiction as to what will happen if the expression has a different constant other than 1.We can conclude from this that as we change the radius the graphs changes, and also the center and the intersection points of the graph changes too. Let's look at the odd powers too and see what will happens.
From the graph we can see a difference compared to graph #6 above. The bump here is solidified and concetrated at the edge, and the lower the exponet the most out is the graph. Here the expont 3 is the most out graph, while the blue is the innermost and its exponent is 7.